Calculation Scripts:- Session 7
We have different category of dimensions in Essbase, when we tag
a dimension as of a
specific type, the dimension can access built-in functionality of that dimension type. In
Essbase we have following types
of dimensions: None, Accounts, Time, Country, Currency and
Attributes. For
our Planning Applications by default the Account Dimension is tagged of as
of
type Accounts and Period of type Time. Lets discuss of the additional
features of Accounts and
Time dimension.

as Accounts across the dimension tagged as Time. Lets understand
the same by an Example,
if you remember we have created a Label only
member named Inventory, blow is our hierarchy
now.

Here is our data:

After running the
default calc the values at Qtr1 will be:

This is because
Opening inventory is marked as TB first and Ending as TB last. Different
options for TB are None, First, Last, Average. First is used when you want
parent values in time
dimension to represent the first value, Last for the
last value and Average is for the Average
value. What if we have #Missing
and Zero, we do have some Skip options: None, Missing,
Zero and both. When
Skip option is set to none, Zero and Missing values are considered when
Parent values are calculated. (None is the default setting). When
Missing is selected then
#Missing values are excluded when Parent values
are calculated. When Zero is selected Zero
values
are excluded and when #Missing and Zero is selected as Skip
option then both Missing
and Zero are executed when parent
values are calculated. Lets complicate it a bit, implement a
logic
where we will create a calc script that calculates opening and additions.
The opening
inventory value is the ending inventory for the previous
month. Additions are the difference
between ending and opening inventory
for the month. January opening inventory is difference
between January’s
ending inventory and additions. Below is the data which we have passed
to
Essbase:

Here we expect values
at the dark green cells, below is the calc script we can on this data.

you will get this
result after executing the above calc script of the data.

Expense Reporting: We always want our actual expense to be lower
then the budget
expense, other wise the variance is not in favor; on
the other hand we always want of profit or
non expense items to
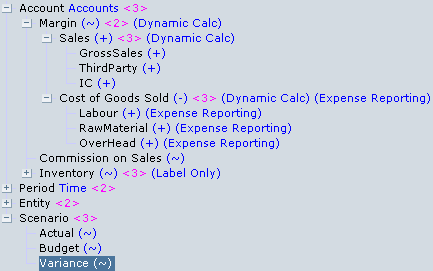
be higher then the budgeted one. To explain it in detail we have added
one
more sparse dimension "Scenario" to our outline, there
are three non aggregating child of
Scenario and
we edited the member properties of Expense Account and Marked them
for
variance reporting.Set variance expense reporting to true for all
the expense accounts:

Here is the script
which we are going to run on our database
The Accounts in Red
are Expense Accounts, we Budget our GrossSales as 980 but it came
out to
be 1000 which is a good sign, so we have a positive Variance where as
in case of labor
we budgeted to spent 600 but we actually spent
800 that is unfavorable as a result though
Actual are more
then budget but still Variance is negative.

Apart from @VAR
function we can also use @VARPER to calculate variance percentages.
Cheers..!!!
Rahul
Rahul


Comments
Post a Comment